Problems that solves
No IT security guidelines
Values
Ensure Security and Business Continuity
Reduce Costs
Gigamon GigaVUE-FM
Centralized Management of the Unified Visibility Fabric The Gigamon® Visibility Fabric™ delivers pervasive and Active Visibility across enterprise, data center, and service provider environments to enable security, network, and application performance analytics and management.
About Product
Description
Centralized Management of the Unified Visibility Fabric
The Gigamon® Visibility Fabric™ delivers pervasive and Active Visibility across enterprise, data center, and service provider environments to enable security, network, and application performance analytics and management.
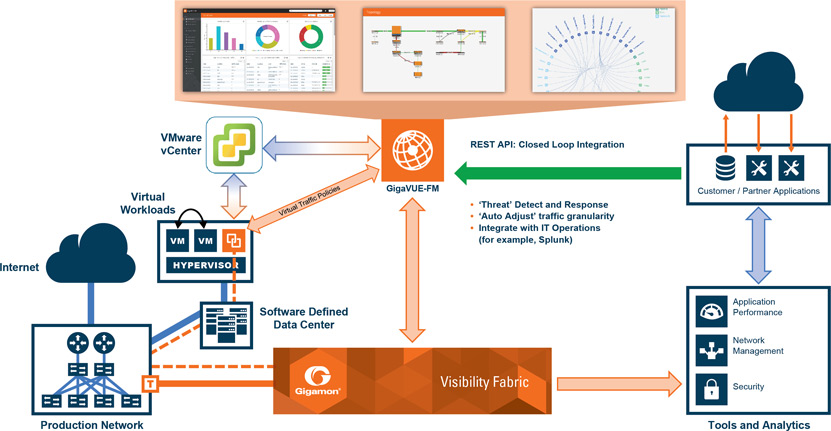
GigaVUE-FM delivers a single-pane-of-glass view of all the physical and virtual nodes across the Visibility Fabric, while also providing an easy-to-use wizard-based approach for configuring patented Flow Mapping® and GigaSMART® traffic policies. Auto-discovery and end-to-end topology visualization of the Visibility Fabric and the connected production networks and summarized dashboards allow operators to view and pro-actively identify hot spots with quick-access capabilities to traffic overlays, node status, events, port, and traffic usage exceptions.
A single instance of GigaVUE-FM can manage hundreds of physical and virtual Visibility Fabric nodes across multiple locations or data centers. With tiered pay-as-you-grow licensing, GigaVUE-FM allows customers to grow their management needs proportional to the complexity, reach and attach of the Gigamon Visibility Fabric to the production networks.
GigaVUE-FM is available as both a software-only virtual appliance for VMware ESX, Microsoft Hyper-V, and KVM hypervisors and as a hardware appliance for deployments where customers prefer a turnkey solution for management, or when the reach and scale of the Visibility Fabric needs dedicated compute capacity for management.
GigaVUE-FM software-only option is available at no charge for single-node management and is also available as a 45-day trial for customers to try multi-node management and other advanced features.
With increasing demands for agility and automation in the IT infrastructure and with ever-changing threat patterns in the network traffic, there is a critical need to automatically detect, react, and respond to these threats while also integrating visibility into IT operations management.
GigaVUE-FM enables Software-Defined Visibility by supporting programmable interfaces using REST APIs to provision and orchestrate the Visibility Fabric. These APIs can be used by traffic monitoring tools (security, NPM, APM), IT operations management, and SDN controllers to:
Program the traffic policies to enable closed loop monitoring by responding to new threat patterns, for example, decrypt SSL, generate NetFlow, or even drop traffic in inline mode if malware is detected
Discover and collect inventory information of the Visibility Fabric to be used for capacity planning or configuration management database (CMDB) analysis
Update traffic flows in the Visibility Fabric based on network traffic re-direction
GigaVUE-FM Diagram
Test Drive
GigaVUE–FM!
Experience centralized control
and traffic policy management
*If you do not have a customer portal login, please click here.
GigaVUE-FM Product Brief
GigaVUE-FM Data Sheet
FabricVUE Traffic Analyzer Web Page
Software-Defined Visibility – The New Paradigm for IT White Paper
Software-Defined Visibility Video
Extending Operational Intelligence for GigaSECURE® with Gigamon Visibility App for Splunk Video
GigaVUE-FM REST API User Guide
Quick Specs
Centralized virtualization, control and management for the Gigamon Visibility Fabric
Single pane-of-glass view across both physical and virtual deployments
Auto-discovery and end-to-end topology visualization of the Visibility Fabric and production networks
Hotspot monitoring and elastic search for faster MTTR
Software-Defined Visibility using REST APIs
Available as software-only virtual appliance or turnkey hardware appliance
Features & Benefits
Centralized Management and Control—Provides centralized management, monitoring, and configuration of the physical and virtual traffic policies for the Visibility Fabric allowing administrators to map and direct network traffic to the tools and analytics infrastructure
Auto Discovery of Network Topology—Automatic discovery and topology visualization of the attached networks using Cisco Discovery Protocol (CDP) or Link Layer Discovery Protocol (LLDP) analysis from the sourced traffic. Using the Visibility Fabric, NetOps and SecOps teams can trace back the production network interfaces that are detected to be at fault—this helps to drastically cut down on the mean time to resolution (MTTR).
End-to-end Topology Visualization with Traffic Overlays—End-to-end visualization of edge-to-core connectivity between the Visibility Fabric nodes, import and display connected production network switches and pre-defined security and monitoring tools, and overlay traffic policies from the ingress network port to the egress tool port.
Fabric-Wide Reporting—Summarize and customize dashboards for inventory, node/cluster status, events, audit trail, and Top-N/Bottom-N port/map usage with options to export and schedule HTML/PDF reports for offline viewing
Advanced Monitoring with Faster MTTR—Pro-actively monitor and troubleshoot hot spots in your Visibility Fabric:
Top-N, Bottom-N Network/Tool Port and Map Usage widgets in the dashboard
Identify unhealthy traffic policies based on network and port operational status
Real-time visualization of port and traffic metrics
Historical trend analysis (1 hour, 1 day, 1 week, 1 month) for port and traffic policies
Elastic search to quickly troubleshoot hotspots (ports, traffic policies, VMs, IPs, MACs, etc.)
FabricVUE™ Traffic Analyzer—Provides fabric-centric visualization of network traffic, allowing IT administrators to use GigaVUE-FM as a first-level dashboard to identify Top-N conversations, applications, end points, and protocols. Uses NetFlow/IPFIX records from GigaVUE® fabric nodes to collect and analyze network traffic:
That is being filtered out of the monitoring appliances
To identify any hot spots on new traffic that needs to be forwarded to the monitoring appliances
Programmable APIs for Software-Defined Visibility—RESTful APIs that can be used by the traffic monitoring or IT operations management tools to discover the Visibility Fabric nodes for inventory and status collection
Gigamon Visibility App for Splunk—Enables integration of the Visibility Fabric inventory, health, port, and traffic insight into Splunk Enterprise
This application, available at no charge from the Splunk App Store (splunkbase), uses Gigamon's Software-Defined Visibility-enabled REST APIs to periodically collect information from GigaVUE-FM and display the data within the Splunk dashboards
A Security or Network Operations Center administrator can now correlate an alert with Visibility Fabric traffic metrics, allowing for a quicker MTTR, all within the Splunk dashboard without having to hop across multiple applications
Use Cases
Centralized Operations Center Administration team looking to configure, direct, and control traffic from a distributed network to the relevant monitoring and analysis tools
Network security team that is chartered with detecting, reacting, and responding to emerging threats based on packet- or flow-based traffic analysis
Agile and automated software-defined data centers (SDDC) that want to monitor and secure virtual workload traffic
SecOps and NetOps teams tasked to monitor and troubleshoot traffic hot spots with the help of the Visibility Fabric
Scheme of work
